What is the Expected Move?
The Expected Move is the amount that a stock or index is expected to move up or down from its current price in any given timeframe, as derived from option prices.
The Expected Move might also be viewed as the consensus of the options trading crowd. A projection of how much the market thinks a stock may move based on expectations of risk (volatility) over a given timeframe.
Why is the Expected Move useful?
The Expected Move can help traders in three key ways:
Estimating potential price moves
Identifying volatility around upcoming events
Finding strategies with higher probability of profit
Search An Expected Move now
Estimating a Price Move
The Expected Move is a useful estimate of how much other traders think a stock or index price may move - so you can gut-check your own view. Using implied volatility (IV), Options AI calculates the Expected Move by using the real-time price of at-the-money option straddles.
Upcoming Events and Higher Implied Volatility (IV)
The Expected Move can help traders identify periods of elevated volatility or ‘fear’ amongst investors. A volatility spike may be due to general market conditions, or it may indicate an upcoming event, such as an earnings announcement. Earnings related moves can be particularly important for those looking to trade the opportunity or to protect underlying stock holdings.
Probability of Profit and Strategy Selection
Knowing what the market thinks might happen to a stock price can help traders take a view on what might not happen - particularly if a trader believes that ‘fear’ amongst investors is overstated. In this scenario, a trader may look to find edge (and higher PoP) by selling options at or outside the expected move.
Even when trading directionally and buying options, the expected move can help guide strategy and strike selection. For example, knowing that a stock is less likely to move outside the expected move, a trader might use the expected move level to simultaneously sell options and create a vertical spread - thereby lowering cost and improving PoP.
Why visual trading from Options AI?
See your way to better trades.
Options AI puts the expected move at the heart of its visual platform - so you don’t just see what a stock has done, but what the market thinks it will do next. Combined with the tools you need to use the move to unlock smarter ways to trade any view.
Here’s how visual trading can help you find edge:
See what the market thinks will happen next so you have the inside track
Compare multiple strategies in seconds so you don’t waste time finding the right trade
Test what a trade may be worth so you know when to get in, get out or let things play out
All on a single intuitive chart that makes everyone a smarter options trader
Try it now
See how easy it is:
View the Expected Move: Clearly shown as a range on your trading chart.
Select Your Direction: Choose bullish if you think prices will rise beyond expectations, bearish if you anticipate a drop, or neutral if you believe prices will stay within the expected range.
Auto-Generate Trades: Instantly receive optimized spreads and multi-leg strategies tailored specifically to your direction and the expected market move.
Try it yourself with our free Expected Move tool
In Depth - Trading Lululemon’s Expected Move with Options AI
When trading options, one of the biggest challenges is determining where a stock might move in the coming weeks. That’s where expected move analysis comes in handy. Instead of guessing, we can use market-driven probabilities to guide our trades.
For this walkthrough, we’re looking at Lululemon (LULU) using Options AI, a platform designed to help visualize expected moves and generate options strategies based on them.
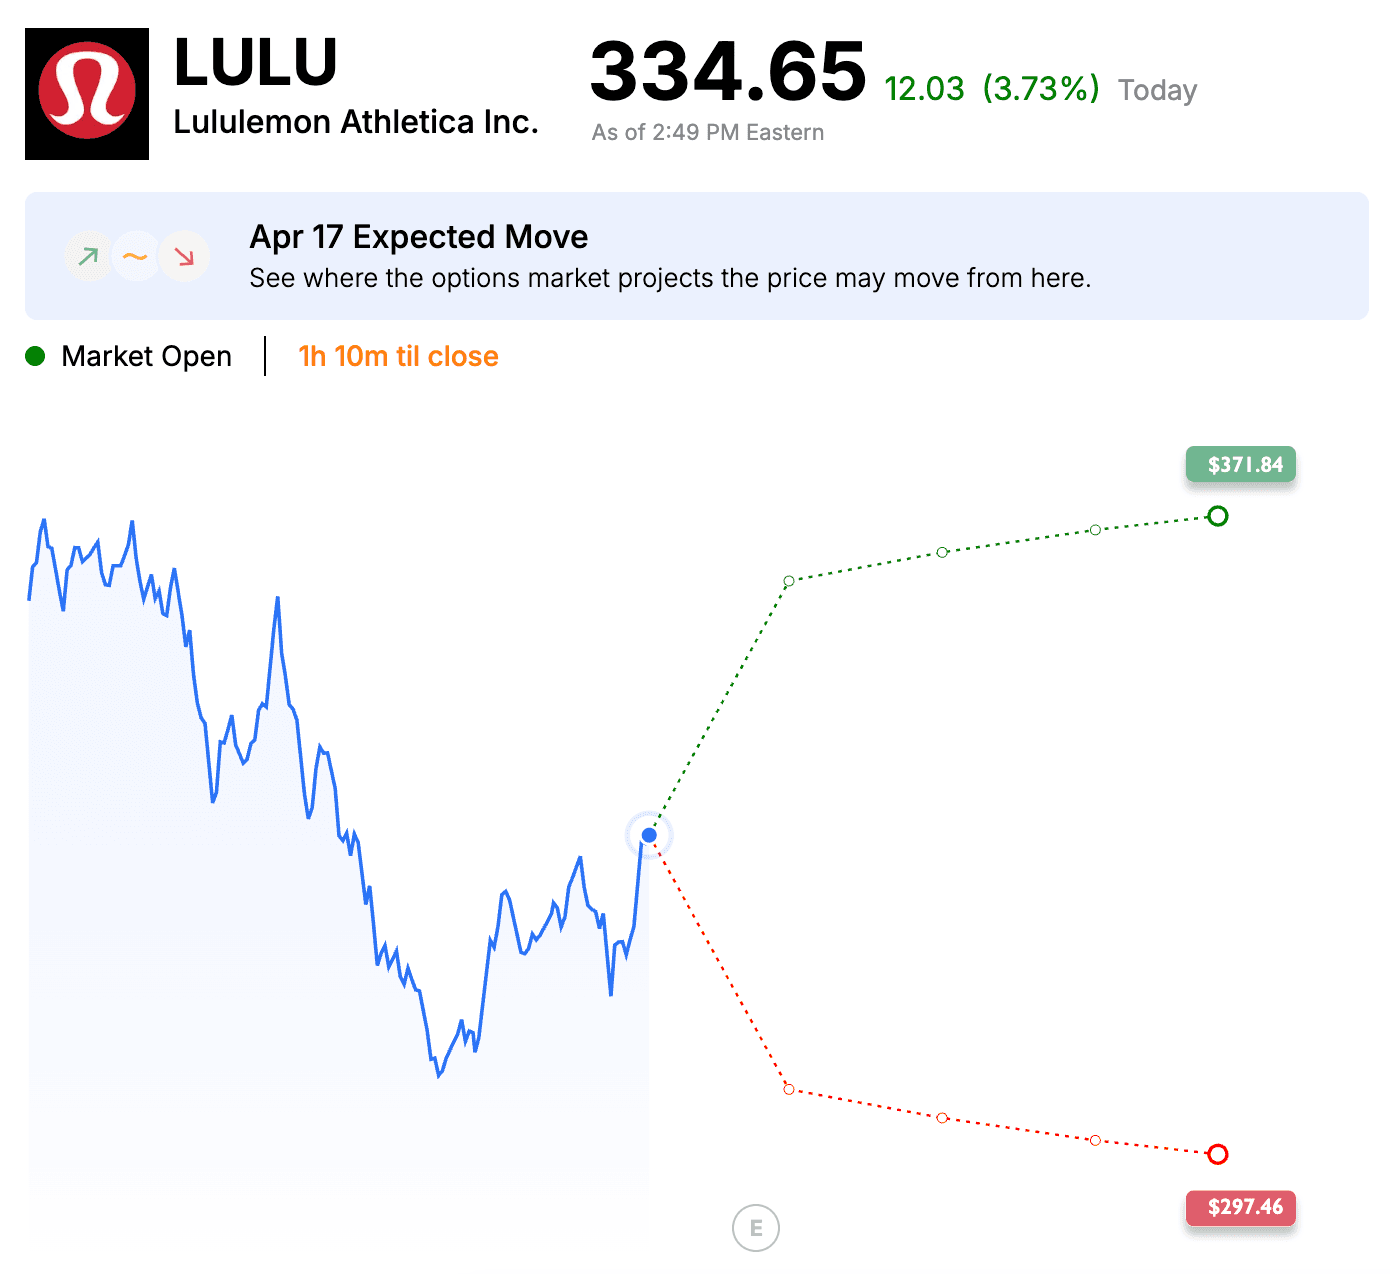
Step 1: Understanding the Expected Move
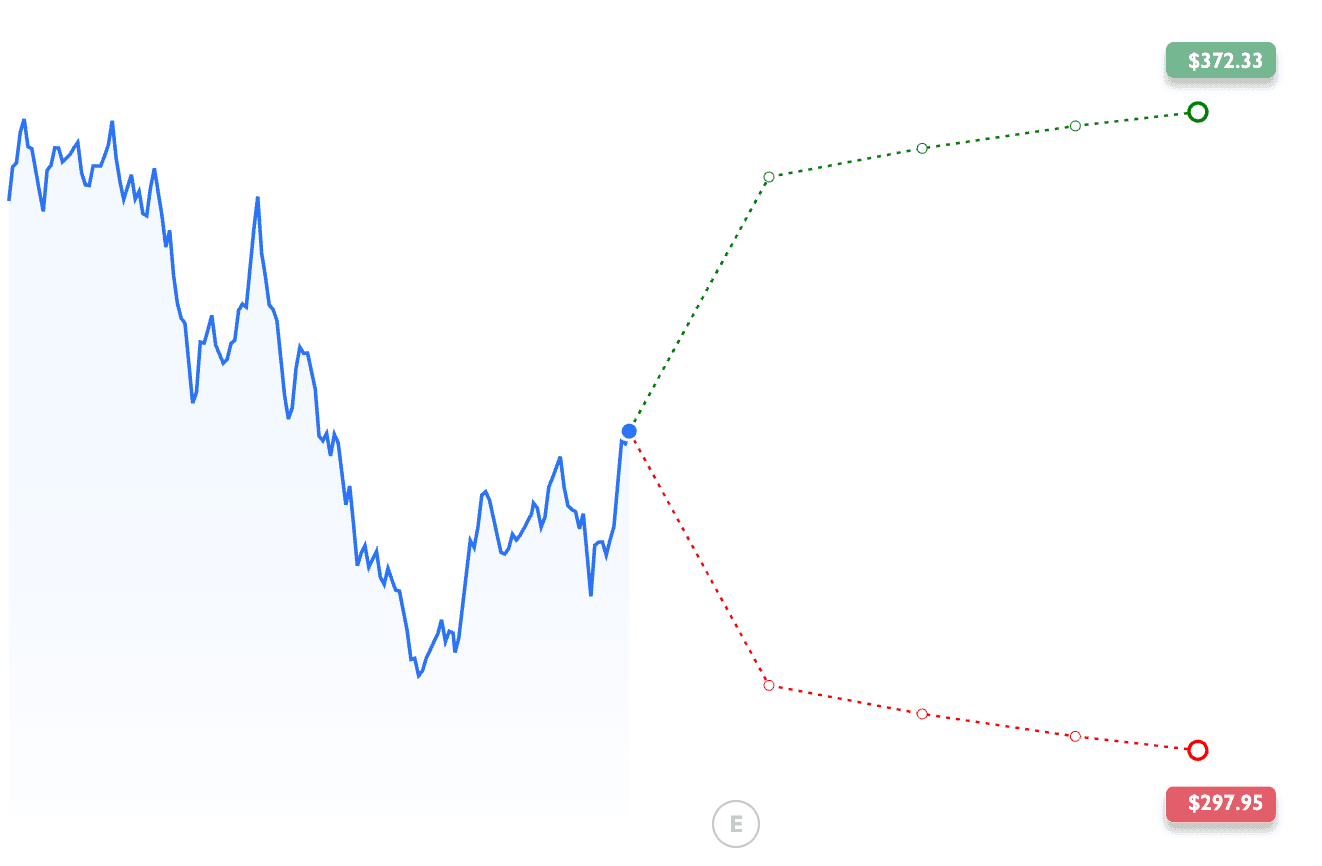
At first glance, we see Lululemon’s current stock price of $333.93, along with a 3.51% increase on the day. Below that, the chart provides an expected move projection—this is the price range the options market suggests LULU could reach by April 17.
In this case, the expected move spans from $297.29 on the downside to $370.58 on the upside. This tells us that based on implied volatility, the options market is pricing in a potential move of about 11% in either direction.
So why is this useful? If we believe the market is underestimating or overestimating LULU’s move, we can structure trades accordingly—whether bullish, bearish, or neutral.
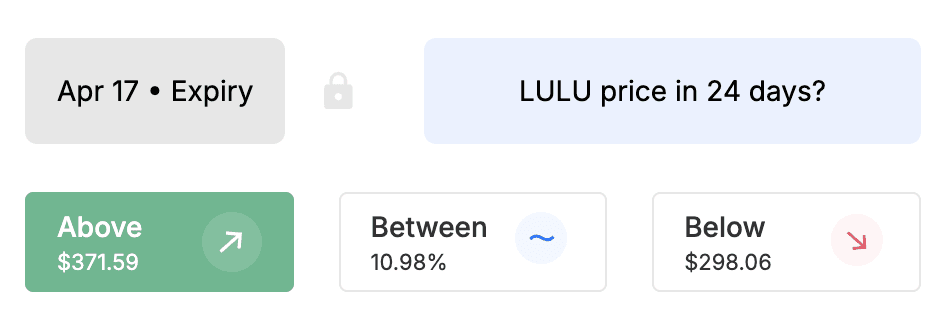
Step 2: Choosing a Market Bias
Options AI simplifies decision-making by breaking trades into three categories:
Above $370.85 (Bullish bias) → Betting on a breakout.
Between (Neutral bias) → Expecting the stock to stay within the expected move range.
Below $297.01 (Bearish bias) → Betting on a drop.
At this point, it’s up to you to decide if you agree with the expected move or have a different outlook based on fundamentals, technicals, or market sentiment.
Step 3: Exploring the Trade Strategies
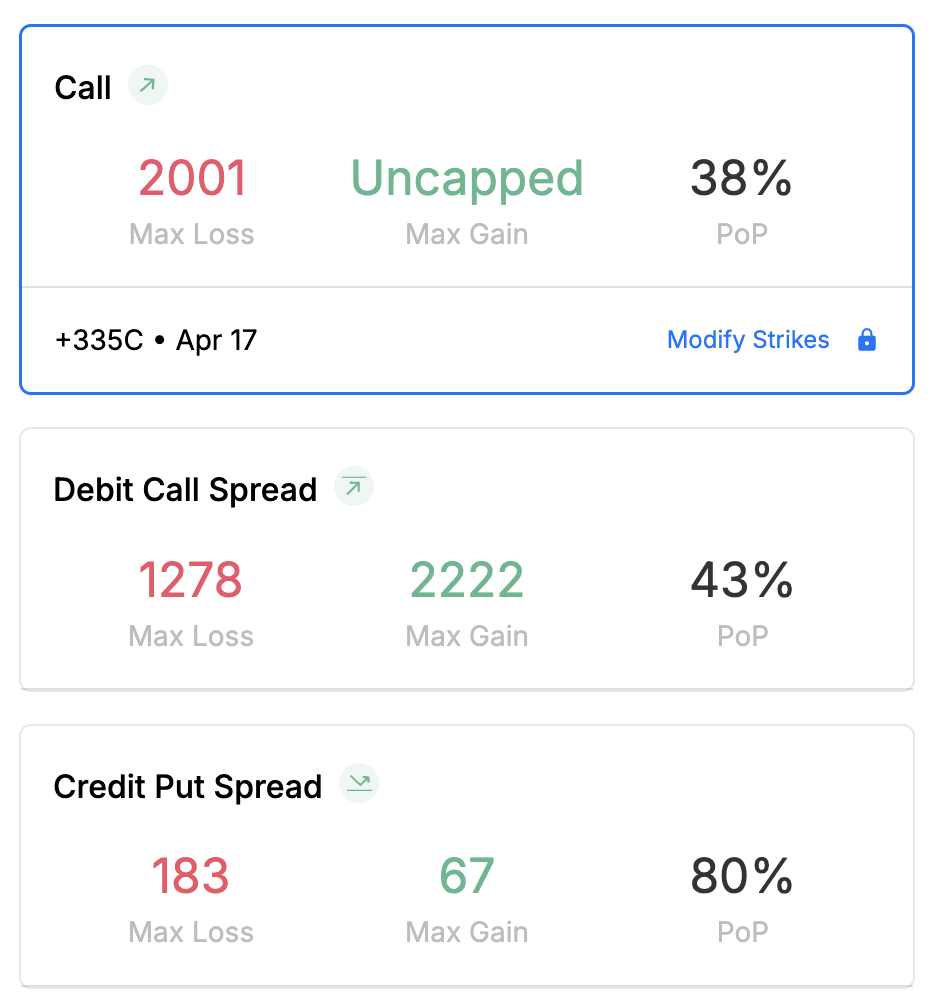
Once a bias is selected, the platform generates pre-built options strategies that align with your view. Here’s a look at the three bullish trades available:
1. Buying a Call (Directional & High Risk)
Max Loss: $2,154 (premium paid)
Max Gain: Uncapped (if LULU rallies hard)
Probability of Profit (PoP): 38%
This is the most aggressive approach—if LULU explodes higher, this trade can deliver big gains. But with only a 38% chance of success, it requires a strong conviction that LULU will move significantly above the expected range.
2. Debit Call Spread (Risk Defined & Balanced)
Max Loss: $1,441 (premium paid)
Max Gain: $2,309 (if LULU goes up to $370.58)
Probability of Profit (PoP): 44%
This strategy limits risk compared to the straight call option but still allows for a solid return. The trade profits if LULU moves higher but caps gains past a certain point.
3. Credit Put Spread (High Probability, Lower Reward)
Max Loss: $195 (if LULU drops below $297.01)
Max Gain: $55 (premium collected)
Probability of Profit (PoP): 80%
This trade takes advantage of the high probability that LULU staysabove a key support level rather than making a big move. It’s a lower-risk approach where you collect a premium as long as LULU remains above a threshold.
Step 4: Finalizing the Trade
Now that we’ve reviewed the options, the final step is to select the trade that best aligns with your market view and risk tolerance.
If you’re confident in a big upside move, the call option offers the highest reward potential.
If you want a balance of risk and reward, the debit call spreadmakes sense.
If you believe LULU won’t drop significantly, the credit put spread is the highest probability trade.
This expected move framework is a great way to approach options trading with a defined plan instead of relying soley on gut feeling.
For more advanced views and alternative strategies, you can unlock additional tools with Options AI’s free trial.
Learn More
Bullish StrategiesNeutral StrategiesBearish StrategiesTry it yourself with our free Expected Move tool
Symbols with Active Stock Options

Apple Inc. (AAPL)

Microsoft Corporation (MSFT)

NVIDIA Corporation (NVDA)

Alphabet Inc. (GOOG)

Amazon.com, Inc. (AMZN)

Meta Platforms, Inc. (META)

Taiwan Semiconductor Manufacturing Company Limited (TSM)

Eli Lilly and Company (LLY)

Broadcom Inc. (AVGO)

Tesla, Inc. (TSLA)

Novo Nordisk A/S (NVO)

JPMorgan Chase & Co. (JPM)

Walmart Inc. (WMT)

UnitedHealth Group Incorporated (UNH)

Visa Inc. (V)

Exxon Mobil Corporation (XOM)

Mastercard Incorporated (MA)

The Procter & Gamble Company (PG)

Johnson & Johnson (JNJ)

Oracle Corporation (ORCL)

Costco Wholesale Corporation (COST)

The Home Depot, Inc. (HD)

AbbVie Inc. (ABBV)

ASML Holding N.V. (ASML)

The Coca-Cola Company (KO)

Bank of America Corporation (BAC)

Merck & Co., Inc. (MRK)

Chevron Corporation (CVX)

Netflix, Inc. (NFLX)

AstraZeneca PLC (AZN)

PepsiCo, Inc. (PEP)

SAP SE (SAP)

Salesforce, Inc. (CRM)

Thermo Fisher Scientific Inc. (TMO)

Adobe Inc. (ADBE)

Toyota Motor Corporation (TM)

Novartis AG (NVS)

Shell plc (SHEL)

T-Mobile US, Inc. (TMUS)

Linde plc (LIN)

Advanced Micro Devices, Inc. (AMD)

Danaher Corporation (DHR)

Accenture plc (ACN)

McDonald's Corporation (MCD)

Alibaba Group Holding Limited (BABA)

Abbott Laboratories (ABT)

Cisco Systems, Inc. (CSCO)

Wells Fargo & Company (WFC)

Philip Morris International Inc. (PM)

Amgen Inc. (AMGN)

QUALCOMM Incorporated (QCOM)

GE Aerospace (GE)

PDD Holdings Inc. (PDD)

Intuit Inc. (INTU)

International Business Machines Corporation (IBM)

Verizon Communications Inc. (VZ)

Pfizer Inc. (PFE)

Texas Instruments Incorporated (TXN)

American Express Company (AXP)

The Walt Disney Company (DIS)

NextEra Energy, Inc. (NEE)

ServiceNow, Inc. (NOW)

Intuitive Surgical, Inc. (ISRG)

TotalEnergies SE (TTE)

Caterpillar Inc. (CAT)

Comcast Corporation (CMCSA)

Unilever PLC (UL)

Morgan Stanley (MS)

HSBC Holdings plc (HSBC)

RTX Corporation (RTX)

S&P Global Inc. (SPGI)

Royal Bank of Canada (RY)

The Goldman Sachs Group, Inc. (GS)

Applied Materials, Inc. (AMAT)

Coca-Cola FEMSA, S.A.B. de C.V. (KOF)

Union Pacific Corporation (UNP)

AT&T Inc. (T)

Lowe's Companies, Inc. (LOW)

BHP Group Limited (BHP)

Sanofi (SNY)

Honeywell International Inc. (HON)

Lockheed Martin Corporation (LMT)

The TJX Companies, Inc. (TJX)

Vertex Pharmaceuticals Incorporated (VRTX)

The Progressive Corporation (PGR)

Stryker Corporation (SYK)

BlackRock, Inc. (BLK)

Elevance Health Inc. (ELV)

ConocoPhillips (COP)

Uber Technologies, Inc. (UBER)

Regeneron Pharmaceuticals, Inc. (REGN)

Arm Holdings plc American Depositary Shares (ARM)

Mitsubishi UFJ Financial Group, Inc. (MUFG)

Prologis, Inc. (PLD)

Anheuser-Busch InBev SA/NV (BUD)

Booking Holdings Inc. (BKNG)

The Charles Schwab Corporation (SCHW)

Citigroup Inc. (C)

Eaton Corporation plc (ETN)